4.2 minute read
April 17, 2020
In this new blog series, Visualizing Risk, Harris & Associates takes a close look at visualization tools available to help local jurisdictions improve their climate adaptation planning with the latest data and forecasts.
California, like so many other coastal states in America, is grappling with the new reality of sea level rise and more frequent coastal flooding events. To assist in their planning efforts, municipal leaders need access not only to projections of future rising and flooding over multiple time horizons, but also to geographic translations of how certain levels of inundation will impact their shorelines.
Fortunately, there are several different tools publicly available offering access to the best sea level rise models on web mapping applications.
Sea Level Rise Viewer
With the National Oceanic and Atmospheric Administration’s Sea Level Rise Viewer, users can visualize community-level impacts from coastal flooding or sea level rise (up to 10 feet above average high tides). The viewer also provides photo simulations of how future flooding might impact local landmarks, along with data related to water depth, connectivity, flood frequency, socioeconomic vulnerability, wetland loss and migration, and mapping confidence. This tool is most helpful for connecting real-time sea level rise scenarios (in feet) to the projected year of impact.
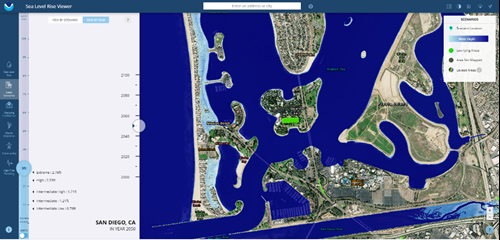
The above snapshot is of the Sea Level Rise viewer.
Our Coast, Our Future Flood Map
Similarly, Our Coast, Our Future (OCOF) Flood Map hosts the Coastal Storm Modeling System developed by the United States Geologic Survey (USGS). This map includes flood extent, depth, duration, wave heights, and shoreline position, among other features.
Most helpful to planners is the ability to interact with 40 combinations of different sea level rise and storm scenarios. In addition to the risk of permanent inundation, high water levels combined with a storm event will flood larger areas for longer periods of time. It is critical to assess flooding extent of sea level rise with consideration for 20-year and 100-year flood events to adequately assess a community’s vulnerability. This tool is also helpful for communities with shorelines characterized by cliffs. OCOF includes cliff position projections based on field observations, such as historical cliff retreat rate, nearshore slope, coastal cliff height, and mean annual wave power.
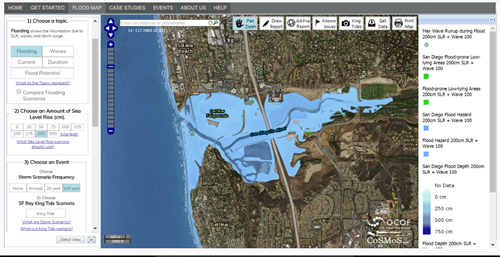
The above snapshot is of the OCOF tool.
ART Bay Shoreline Flood Explorer
For local jurisdictions in the Bay Area, the ART Bay Shoreline Flood Explorer provides flood maps and associated analyses at the regional scale. The maps support adaptation planning by capturing:
- Over 90 combinations of future sea level rise and storm surge scenarios
- Shoreline overtopping maps for all 10 total water levels that depict where the Bay may overtop the shoreline and its depth of overtopping at that specific location
- Hydraulically disconnected low-lying areas that represent areas that may be more susceptible to flooding
The Flood Explorer maps were produced using the latest LiDAR topographic data sets, water level outputs from the FEMA San Francisco Bay Area Coastal Study (which relied on hydrodynamic modeling using MIKE21), and the San Francisco Tidal Datum Study.
Hazard Exposure Reporting and Analytics
A less publicized but powerful resource is USGS’s Hazard Exposure Reporting and Analytics (HERA) tool. Along with providing inundation maps associated with storm-sea level rise combination scenarios, it is unique in providing impact analytics including community exposure, critical facilities and infrastructure, land cover, and associated economic losses.
The community exposure and critical facility analyses focus on quantifying populations or assets within hazard zones. Meanwhile, the land cover analysis reveals the amount and type of land cover within hazard zones based on the 2016 National Land Cover Database.
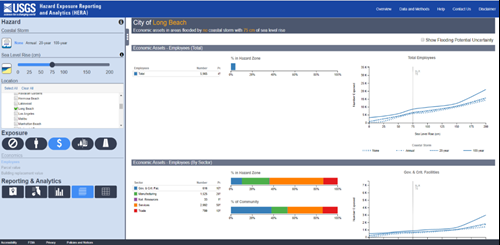
The above charts were exported from the USGS/s Hazard Exposure Reporting and Analytics (HERA) tool.
Lastly, the economic loss analysis focuses on three elements:
- The amount and type of employees impacted to characterize local economies
- Tax parcel values to estimate impacts to funding for local services
- Building replacement costs to estimate direct losses
Navigating Your Options for Sea Level Rise
Effective tools exist to help your community prepare for the challenges and risks of sea level rise and coastal flooding. Harris’ adaptation and resilience experts help you select the best options and transform data into plans of action. Read more about helpful tools on our blogposts on extreme heat, extreme precipitation, and drought. To learn more about how we can help assess and mitigate risks, please visit our Risk + Resilience page.
Source
Harris & Associates
Markets
Municipal
Planning + Development
Services
Climate Change + Sustainability
Risk + Resilience
Community Planning
Categories
Climate Adaptation