3.6 minute read
April 17, 2020
In this new blog series, Visualizing Risk, Harris & Associates takes a close look at visualization tools available to help local jurisdictions improve their climate adaptation planning with the latest data and forecasts.
Increasing temperatures and changes in precipitation may lead to longer, more severe droughts. By 2050, California is projected to lose at least 25 percent of the Sierra snowpack, an important source of urban, agricultural, and environmental water.
To adequately prepare for drought events, local jurisdictions must assess and communicate the extent to which their community is exposed and sensitive to climate stressors. Harris has identified and reviewed several models and tools available for municipalities and governing agencies to do so in their planning documents.
Palmer Drought Severity Index
The Palmer Drought Severity Index (PDSI) uses temperature and precipitation data to calculate water supply (precipitation) and demand (evapotranspiration driven by temperature), while incorporating soil moisture. PDSI raster data is available to download for the entire United States at 2km resolution on the West Wide Drought Tracker. The figure here shows a sample map for San Diego County during August 2014 made utilizing PDSI data.
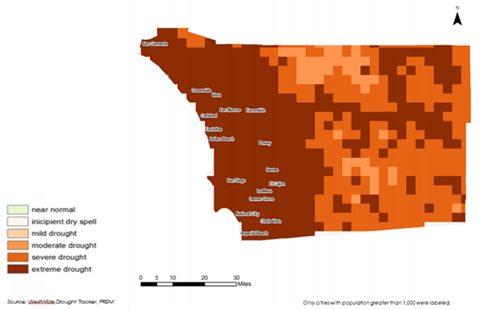
Example of Palmer Drought Severity Index map
U.S. Drought Monitor
Local governments can easily interact with PDSI data for their specific jurisdiction or planning area using the U.S. Drought Monitor (USDM) data and maps. The USDM’s recently revamped website provides various drought maps and graphics that can be easily inserted into planning documents, reports, or presentations.
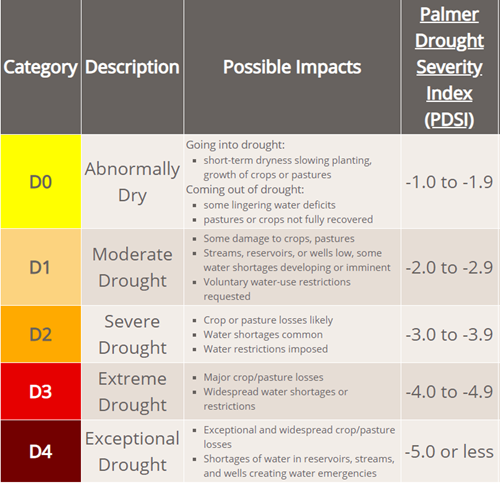
Every week, the USDM releases a new map showing parts of the U.S. experiencing drought conditions. Users can customize drought maps by request and rely on five categories that correspond to PDSI ranges, as seen by the figure below.
In addition to maps and tables that summarize the percent of the project area experiencing drought by intensity, the website allows users to export timelines highlighting historical drought conditions, also seen below.
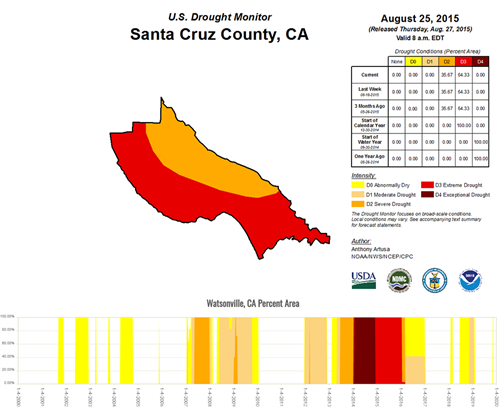
The U.S. Drought Monitor website allows you to export timelines, as seen above.
Normalized Difference Vegetation Index
Local jurisdictions find value in drought impact visualizations to complement historical drought event data. One way to communicate drought’s potential impact on a region’s plant health is a Normalized Difference Vegetation Index (NDVI), a measure of vegetation greenness.
NDVI values can tell us about the density of vegetation (how much plant life is in an area) and how productive the plants are (more productive vegetation is actively photosynthesizing). The higher a region’s NDVI value, the more photosynthesis is occurring in that region.
By calculating and displaying the percent change in NDVI over time, planners can effectively communicate changes in vegetation health due to drought.
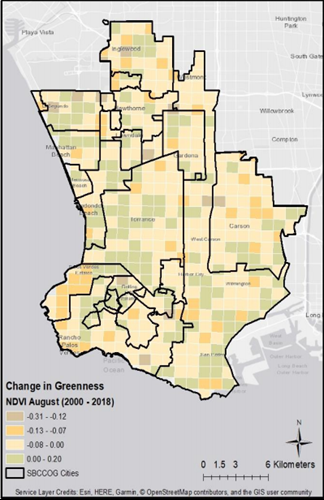
Examples of a measure of vegetation greenness from the Normalized Difference Vegetation Index
Drought Impact Reporter
Additionally, the National Drought Mitigation Center’s Drought Impact Reporter quantifies and categorizes drought impacts based on reports from users, the media, and other agencies. Users can search impacts by location, time interval, categories, dollar losses, or keyword. It is the nation’s first comprehensive database of drought impacts, but it has not been updated since 2011.
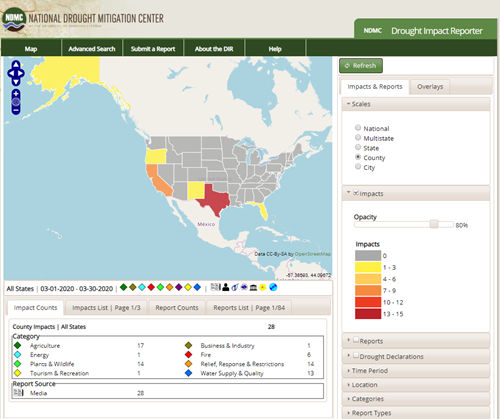
The image above shows a snapshot of the Drought Impact Report
Plan to Mitigate Your Drought Risks
The climate adaptation team at Harris & Associates has experience using these tools and others to help local jurisdictions better comprehend and mitigate risks related to drought conditions. To learn more about how they can improve your planning, please visit our Risk + Resilience page or contact one of the authors below directly.
Source
Harris & Associates
Markets
Municipal
Planning + Development
Services
Climate Change + Sustainability
Risk + Resilience
Community Planning
Categories
Climate Adaptation