5.9 minute read
April 17, 2020
In this new blog series, Visualizing Risk, Harris & Associates takes a close look at visualization tools available to help local jurisdictions improve their climate adaptation planning with the latest data and forecasts.
Due to climate change, average warmer temperatures and heat waves are expected to increase in frequency, intensity, and duration throughout the next century. California’s 4th Climate Change Assessment estimates that average annual maximum daily temperatures will increase by as much as 8.8 degrees by 2100.
This increase in temperature will exacerbate the urban heat island effect in cities, and negatively impact human health by increasing the frequency of heat-related illnesses, such as heat stroke, especially amongst vulnerable populations, including elderly adults and those with pre-existing conditions.
To adequately prepare for heat events, local jurisdictions must assess and communicate their community’s potential exposure and sensitivity to a given climate stressor.
Tools, Models, and Methods to Communicate Risk
Harris has identified and reviewed several tools, models, and methods available for municipalities and governing agencies to communicate the risk of heat events and to identify priority areas for heat adaptation investments in planning documents.
Cal-Adapt
Cal-Adapt provides easily accessible climate data, which includes local projections of annual average temperatures, extreme heat days, and warm nights. The data can be summarized in a table or easily exported as a graphic.
The chart featured here shows the number of days per year when daily maximum temperature is projected to exceed the extreme heat threshold. By default, the “threshold temperature” is calculated as the 98th percentile of historical daily maximum temperatures based on data from 1961-1990. The custom area selected under the RCP 8.5 (“business as usual”) scenario shows results from four climate models in which emissions will continue to increase dramatically through 2050, peaking around 2100.
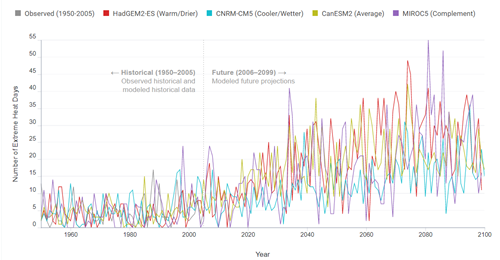
Example of Cal-Adapt climate change data chart
Cal-Adapt recently released a new tool that enables users to visually compare differences in temperature under various climate scenarios. This “swipe” feature improves the ability to communicate the impact of climate change for larger regions. Because the resolution is low, it is not as useful for representing climate risk in a planning document for a particular jurisdiction.
While Cal-adapt provides the best available climate projections for Californian jurisdictions, its tools do not specify where a city should prioritize adaptation measures. Instead cities can utlize a hotspot or Urban Heat Island model to identify the best location for targeting tree canopy, white pavement, or other adaptation investments.
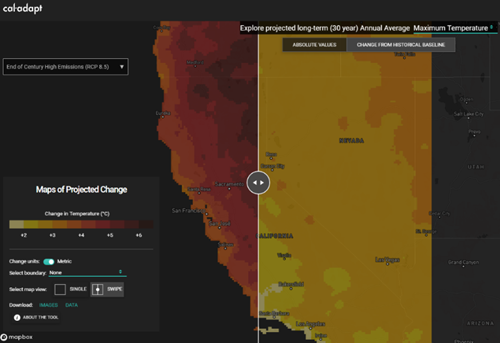
Example of Cal-Adapt Map of Projected Change
Hotspot Tool
The Trust for Public Land developed an easily replicable model that local jurisdictions can use to identify hotspots with elevated daytime land surface temperature within the top 5% of August’s mean daily temperature. The model’s results were derived from Landsat satellite data, which provides a 30m downscaled average land surface temperature over 16-day periods.
The image here displays the model output using an average of two Landsat scenes from August 2019. While the Climate Smart Cities Tool only covers LA County (within California), the model can be re-created using USGS Landsat Data by following their published methodology.
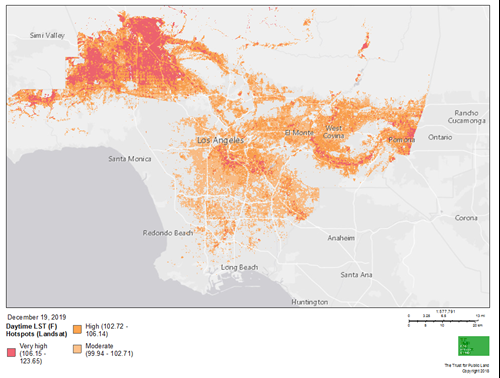
Example of Landstat Model Output
California EPA Urban Heat Island Index
California’s Environmental Protection Agency Urban Heat Island Index also models the relative distribution of heat exposure for the entire state. However, due to lack of data variation within an individual city’s boundary, these maps are less helpful to city planning efforts. Download data files here.
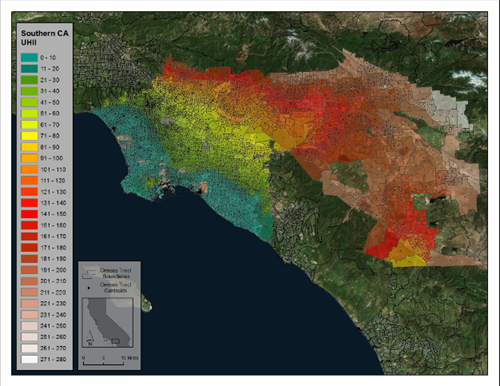
Example of California’s Environmental Protection Agency Urban Heat Island Index model
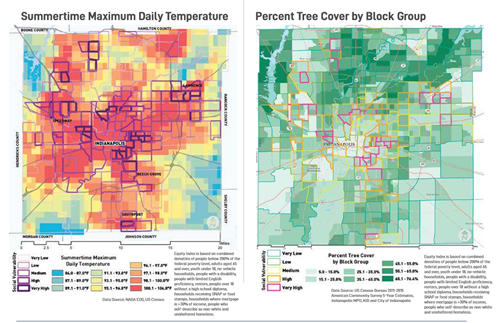
Overlay Maps
Maps that layer hotspot areas over social vulnerability or sensitivity data help pinpoint priority areas for a city’s heat mitigating activities. The simplest overlay method—manipulating the symbology to display the two separate layers on one map—is showcased in Indianapolis’s Thrive Plan, pictured here.
Principal Component Analysis (PCA)
Developing a vulnerability index is a more methodologically complex but aesthetically efficient way to combine heat exposure (temperature) and sensitivity indicators. This involves running a Principal Component Analysis (PCA). PCA identifies the composite index of components, each including a subset of exposure and sensitivity indicators. These are independent of each other, and therefore can be added together for a more accurate composite heat vulnerability index.
The University of South Carolina’s Hazards and Vulnerability Research Institute created a replicable methodology to develop a vulnerability index. Various local jurisdictions including San Francisco, Santa Cruz, and the South Bay and Western Riverside Council of Governments developed a custom SoVI. San Francisco’s social vulnerability index is shown here.

Example of Social Vulnerability Index
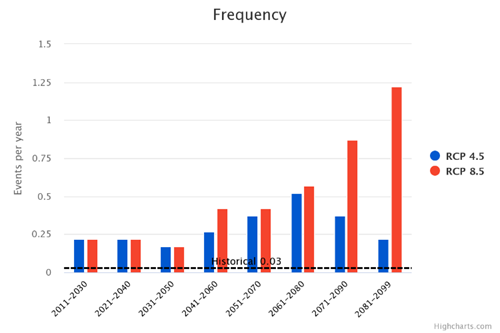
Climate Heat Assessment Tool
Four Twenty Seven developed a Climate Heat Assessment Tool (CHAT) which conveys the dimensions of climate change-driven heat vulnerability and determines where to take action to mitigate the public health impacts of extreme heat.
Planners and practitioners can export a chart showing how the frequency of heat-related health events are expected to increase over time by census tract under different emissions pathways. A heat-related health event is defined as any heat event that negatively impacts public health.
CHAT also provides a heat health action index that ranks each census tract in the state, supported by health, social vulnerability, and environmental indicators. Importantly, CHAT also factors humidity into its vulnerability ranking rather than relying on absolute temperatures.
Example of Climate Heat Assessment Tool
Prepare Your Community for Extreme Heat
The strategic advisors at Harris have experience with these and other visual models and tools to help you assess and effectively communicate the risks of extreme heat. To learn more about applying these tools to your planning efforts, please check out our Risk + Resilience page or contact one of the authors below directly.
Source
Harris & Associates
Markets
Municipal
Planning + Development
Services
Climate Change + Sustainability
Risk + Resilience
Community Planning
Categories
Climate Adaptation