3.2 minute read
April 17, 2020
In this new blog series, Visualizing Risk, Harris & Associates takes a close look at visualization tools available to help local jurisdictions improve their climate adaptation planning with the latest data and forecasts.
In my two previous blog posts, I discussed visualization tools to aid in planning efforts and risk mitigation for extreme heat and drought. Here, you’ll see a variety of options for visualizing local flooding risks throughout California.
Flood hazards are traditionally represented by FEMA-designated 100- and 500-year floodplains. These floodplains map the potential occurrence of freshwater flowing in a river or stream exceeding its holding capacity and overrunning the banks. However, extreme precipitation events projected under climate change scenarios increase the likelihood of inland, urban flooding—not just riparian flooding.
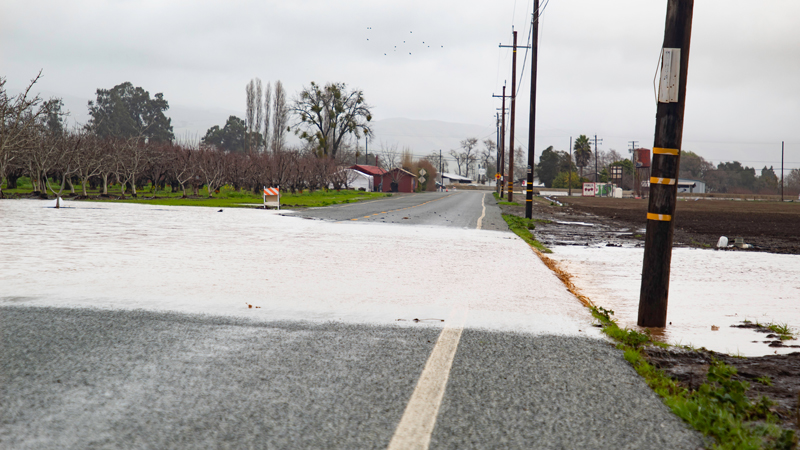
Urban flooding, commonly called flash floods, cloudbursts, or inland flooding, is caused by short, intense rainfall events often associated with sudden storms or downpours from large storm systems like atmospheric rivers. Sewer and drainage capacity, local topography, and the ground’s capacity to absorb rainfall (percent impervious surface) are the main factors that contribute to inland flooding risk. In fact, urban flooding has little to do with bodies of water and occurs in places well outside of mapped floodplains.
To adequately prepare for urban flooding local jurisdictions must assess and communicate their projected exposure to extreme precipitation. Harris has identified and reviewed several tools, models, and methods available for municipalities and governing agencies to communicate risks and identify priority areas for adaptation interventions/projects.
Cal-Adapt Tool
Using the Cal-Adapt tool, municipalities can quantify the potential for extreme precipitation events by projecting their frequency and intensity under different emissions scenarios. However, the outputs do not inform where a city might experience heightened risk or should prioritize adaptation measures.
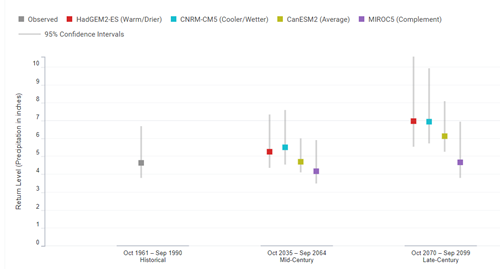
Example of a chart exported from Cal-Adapt.
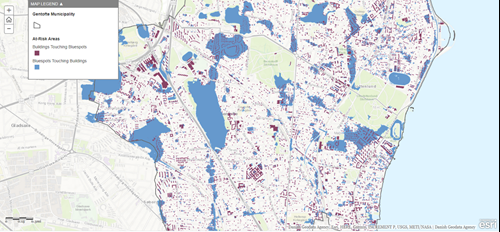
Bluespot Model
The Bluespot Model identifies flood-prone areas and at-risk structures during sudden rainstorms by calculating how much rainfall is needed to make each bluespot (depression or sink in the landscape) fill up during a cloudburst. The results of the bluespot maps are polygons representing low lying areas that could fill up and overflow in heavy rains.
Planners and developers can use bluespot maps to make informed decisions about where not to build or where development should include special landscape architecture. In developed areas, bluespot maps can help prioritize areas for better climate-proofing.
Learn more in the step-by-step guide to developing a bluespot map for a given planning area here.
Priority Absorb Layer
The Trust for Public Land’s Climate Smart Cities Priority Absorb Layer complements the bluespot map by identifying priority areas for green infrastructure investment. The model was created using a weighted overlay identifying overlaps among the following layers:
- Riparian areas (5%)
- Flood prone areas (5%)
- Permeable soils (25%)
- Wetland areas (5%)
- Groundwater basins (30%)
- Historic channels (10%)
- Slope (20%)
This model could be easily replicated and incorporated into planning documents for other regions.
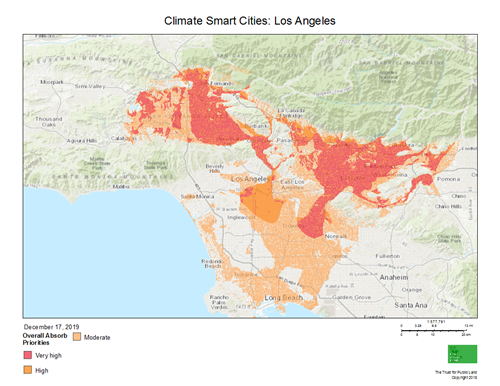
The map above is of the Priority Absorb Layer.
Improve Your Rainstorm Readiness
The adaptation and resilience specialists at Harris have considerable experience with these and other visual tools and models to help assess and communicate risks of extreme precipitation. To learn more about applying these tools to your planning efforts, please visit our Risk + Resilience page or contacting one of the authors below directly.
Source
Harris & Associates
Markets
Municipal
Planning + Development
Services
Climate Change + Sustainability
Risk + Resilience
Community Planning
Categories
Climate Adaptation